In order to quickly assess the convenience of the ThermBooster™ heat pump of SPH Sustainable Process Heat GmbH, the simple pay-back time was calculated, using 140 different combinations for the costs of thermal and electrical energy. The installation used for the case study has the following characteristics:
average heat output: 600 kWt
Average COP: 4,0
number of operating hours 7.000 hrs/yr
investment: € 412.500, –
maintenance: € 8.250 per year
The results are shown in the table on the left. With this matrix and the local costs for energy, one can easily find out whether the heat pump is economically interesting or not.
N.B. These data refer to a machine with one compressor only. Machines with two compressors or more, are more cost effective.
Simple payback time as function of the costs of energy
N.B. one could be inclined to think that the economic convenience of a heat pump depends only on the ratio between the cost of thermal energy and the cost of electrical energy. However a closer look at the problem reveals that the general price level of energy has a significant impact as well, as is demonstrated by this example:
The table above shows that with a cost of electricity of € 0,175 per kWh and that of thermal energy of € 0,06 per kWh, the simple pay-back time of the system would be 6,88 years. If the cost for both sources of energy were to double, the ratio between the two would remain unchanged but the table shows that the payback time would be only 3,22 years.
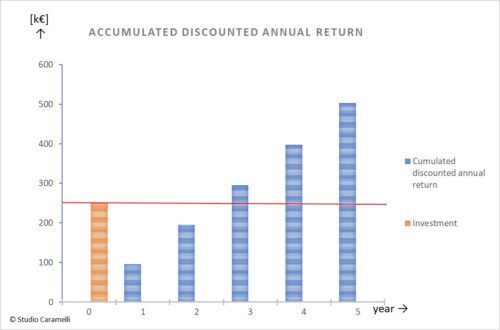
accumulated discounted annual return
In order to better understand the cost-effectiveness of a typical system with the ThermBooster™ heat pump from SPH Sustainable Process Heat GmbH (the Base Case), the discounted cash flows of such a system are presented in the graph on the left. The energy costs are undergoing strong variations these days and it is not clear what the average price level will be for the coming years. For the calculations presented in the graph, the costs for electricity was assumed to be equal to € 0,25 per kWh and the costs for thermal energy was set equal to € 0,09 per kWh.
The graph shows that already in the third year, the project begins to generate benefits. Over five years, the IRR (Internal Rate of Return) is equal to 32%.
One should bear in mind that a reasonable estimate of the technical life of the ThermBooster™ is at least 10 years.
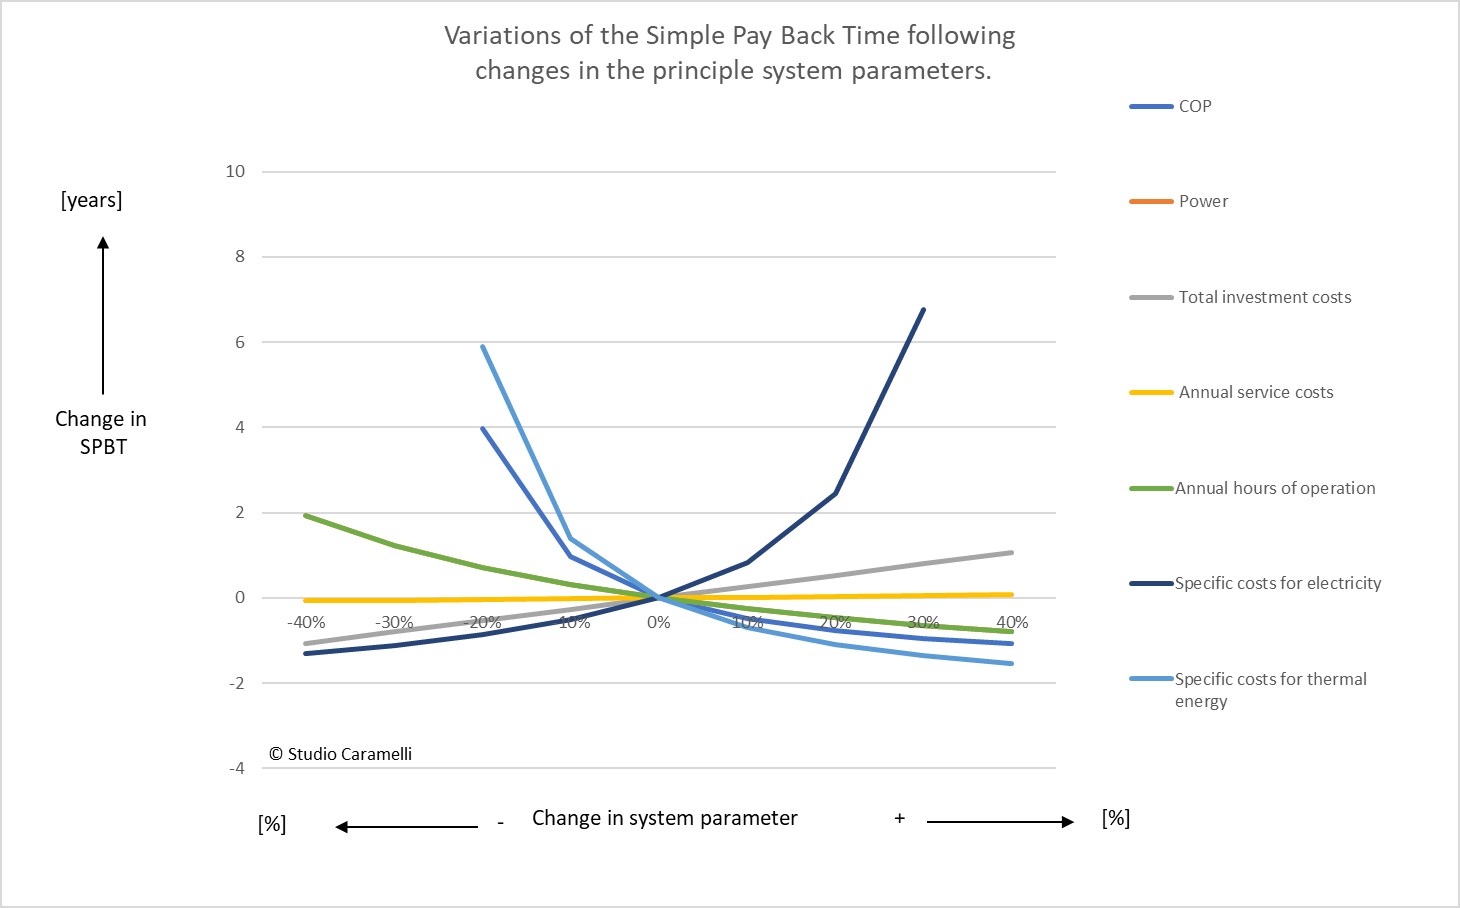
sensitivity analysis
The economic convenience of a heat pump depends on many parameters. To put the relative importance of the different parameters in evidence, a sensitivity analysis is presented in the graph on the right. The graph shows the variation in the simple pay-back time in the event that one of these seven parameters varies between +/- 40% on the value of the Base Case.
The graph shows that the three parameters that have the greatest impact on the payback time are:
the COP,
the cost of thermal energy,
the cost of electricity,
the other parameters have much less impact on the economic performance of the heat pump.
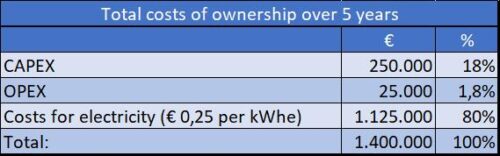
total cost of ownership
Total Cost of Ownership (TCO) is the cost for the investment plus all the cost for operating an installation during its useful life time. The idea is to take into consideration the total cost that a plant owner has to sustain for having and using an asset during the years of ownership and not just the initial costs of acquisition. Calculating the TCO is important when comparing different investment options. The table on the left shows the TCO calculated over a five-year period for the example of the Base Case. The table shows that even over a relatively short period of time and assuming zero residual value after five years, the initial investment only accounts for 18% of the total costs. The expenses for electricity represent by far the most important cost item (80% of the TCO).
This result indicates that the number of yearly hours of operation does not affects the economy ThermBooster™ very strongly. So projects in which the heat pump does not run all the time at full capacity, can nevertheless be economically attractive. This is in line with the sensitivity analysis presented above. The fact that the cost of electricity is the main cost item implies that in the design phase we must try to reduce electricity consumption as much as possible. The best way to do this is to optimise the COP by minimizing the temperature difference between the evaporator and the condenser (see here).
incentives
The calculations of the economic convenience presented here do not include the benefits derived from possible government incentives. For example, in Italy, an industrial heat pump is, in principle, eligible for incentives through the White Certificates scheme (TEE). For the Base Case taken here as example, the primary energy savings would be around 160 toe/year which would bring 160 TEE with a total value of approximately € 40,000 each year, for a period of seven years.
(N.B. the access conditions and the amount of the incentive may change. It is recommended to check, case by case, with the GSE if your heat pump project can have access to the TEE mechanism and under what conditions.)
ets
A typical application of the ThermBooster™ heat pump from SPH Sustainable Process Heat (the Base Case), in Italy, would lead to an annual reduction in CO2 emissions of about 567 [t], compared to a boiler using natural gas. A reduction of 70%.
If the heat pump operator falls under the EU Emissions Trading System (ETS), with a carbon price of 50,00 €/t, the reduction in carbon emissions would reduce the yearly plant operation costs by circa € 28.350, – . That is more than 10% of the investment costs for the ThermBooster™ every year.
In the optimal situation, when the heat pump is powered exclusively with renewable electricity, the CO2 emission avoided would be 816 [t] with an annual economic benefit of approximately € 40.000,00